Machine learning - Regression - Polynomial Regression
Polynomial Regression es una ecuacion de de grado n, con n un numero natural
Importing the libraries
import numpy as np 			# trabajo con arrays
import matplotlib.pyplot as plt 	# para hacer gráficos
import pandas as pd 			# importar los datasets, la matriz de características y el vector de variable dependiente
Importing the dataset
dataset = pd.read_csv('Position_Salaries.csv')


print(dataset)
            Position  Level   Salary
0   Business Analyst      1    45000
1  Junior Consultant      2    50000
2  Senior Consultant      3    60000
3            Manager      4    80000
4    Country Manager      5   110000
5     Region Manager      6   150000
6            Partner      7   200000
7     Senior Partner      8   300000
8            C-level      9   500000
9                CEO     10  1000000


X = dataset.iloc[:, 1:-1].values	# No importo la primera columna porque no aporta inforamcion
y = dataset.iloc[:, -1].values		# pongo en el panda dataset y todas las filas de la ultima columna


print(X)
[[ 1]
 [ 2]
 [ 3]
 [ 4]
 [ 5]
 [ 6]
 [ 7]
 [ 8]
 [ 9]
 [10]]


print(y)
[  45000   50000   60000   80000  110000  150000  200000  300000  500000
 1000000]
Splitting the dataset into the Training set and Test set
En este caso no hace falta hacer un split del dataset
Training the Linear Regression model on the whole dataset
Hago un modelo linea para compararlo con el polinomico

from sklearn.linear_model import LinearRegression
lin_reg = LinearRegression()
lin_reg.fit(X, y)
Training the Polynomial Regression model on the whole dataset
from sklearn.preprocessing import PolynomialFeatures

poly_reg = PolynomialFeatures(degree = 4) 			# degree es el mayor exponente del polinomio

X_poly = poly_reg.fit_transform(X) 				# Entreno el modelo y convierto mi caracteristica que tenía una columan en tantas columnas como tengo en degree
								# columna 0 = 1
								# columna 1 = valor original de X
								# columnas 2, 3 y 4 valores del modelo de transformacion

print(X_poly)
[[1.000e+00 1.000e+00 1.000e+00 1.000e+00 1.000e+00]
 [1.000e+00 2.000e+00 4.000e+00 8.000e+00 1.600e+01]
 [1.000e+00 3.000e+00 9.000e+00 2.700e+01 8.100e+01]
 [1.000e+00 4.000e+00 1.600e+01 6.400e+01 2.560e+02]
 [1.000e+00 5.000e+00 2.500e+01 1.250e+02 6.250e+02]
 [1.000e+00 6.000e+00 3.600e+01 2.160e+02 1.296e+03]
 [1.000e+00 7.000e+00 4.900e+01 3.430e+02 2.401e+03]
 [1.000e+00 8.000e+00 6.400e+01 5.120e+02 4.096e+03]
 [1.000e+00 9.000e+00 8.100e+01 7.290e+02 6.561e+03]
 [1.000e+00 1.000e+01 1.000e+02 1.000e+03 1.000e+04]]

lin_reg_2 = LinearRegression() 					# creo una linar regression basada en las nuevas caracteristicas

lin_reg_2.fit(X_poly, y)					# aplico la regresion lineal porque al final es una regresion lineal
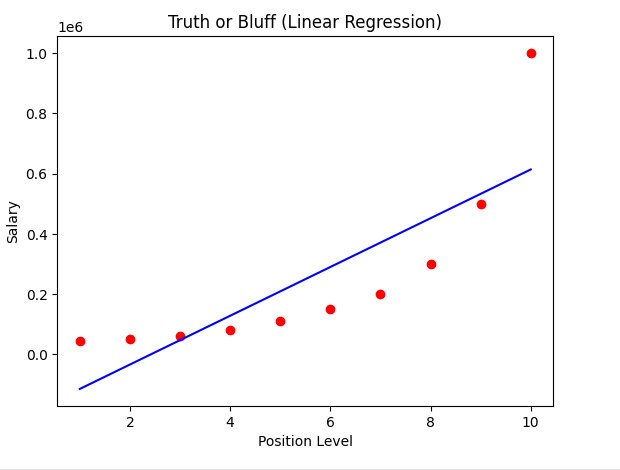
Visualising the Linear Regression results
plt.scatter(X, y, color = 'red')
plt.plot(X, lin_reg.predict(X), color = 'blue')
plt.title('Truth or Bluff (Linear Regression)')
plt.xlabel('Position Level')
plt.ylabel('Salary')
plt.show()
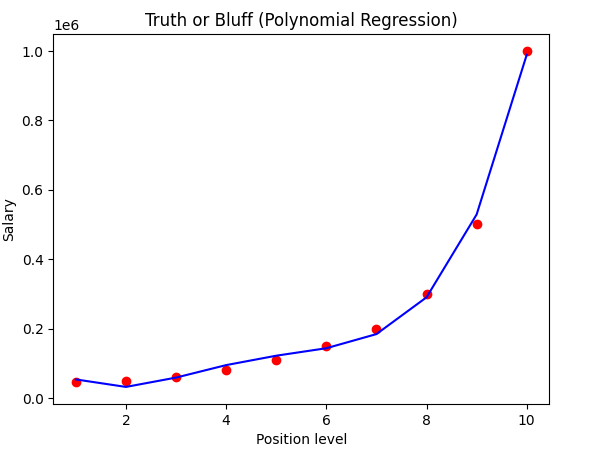
Visualising the Polynomial Regression results
plt.scatter(X, y, color = 'red')
plt.plot(X, lin_reg_2.predict(poly_reg.fit_transform(X)), color = 'blue')
plt.title('Truth or Bluff (Polynomial Regression)')
plt.xlabel('Position level')
plt.ylabel('Salary')
plt.show()
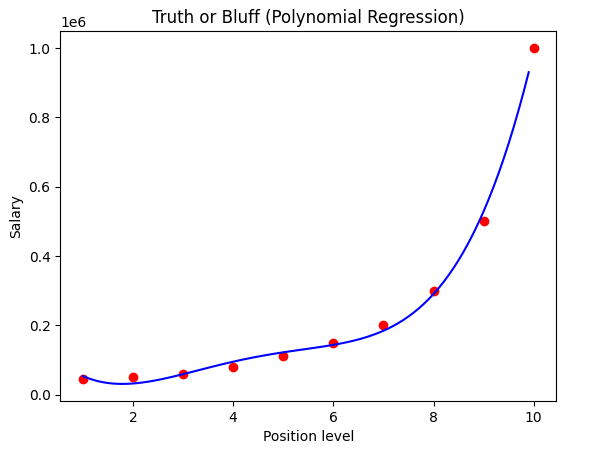
Visualising the Polynomial Regression results (for higher resolution and smoother curve)
X_grid = np.arange(min(X), max(X), 0.1)
X_grid = X_grid.reshape((len(X_grid), 1))
plt.scatter(X, y, color = 'red')
plt.plot(X_grid, lin_reg_2.predict(poly_reg.fit_transform(X_grid)), color = 'blue')
plt.title('Truth or Bluff (Polynomial Regression)')
plt.xlabel('Position level')
plt.ylabel('Salary')
plt.show()
Predicting a new result with Linear Regression
Hago la prediccion para un valor de 6,5

lin_reg.predict([[6.5]]) # row,column
array([330378.78787879])
Predicting a new result with Polynomial Regression
lin_reg_2.predict(poly_reg.fit_transform([[6.5]])) # row,column
array([158862.45265155])